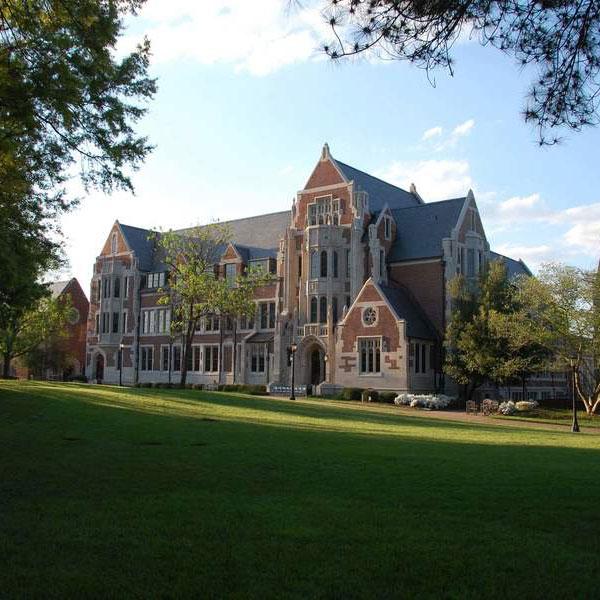
Agnes Scott College is pleased to provide the following information to students and prospective students in compliance with requirements established by the Higher Education Act of 1965, as amended, the Higher Education Opportunity Act of 2008 and the Student Right-to-Know Act of 1990. These data reflect enrollment as of the fall 2023 semester census date.
Questions related to this information should be directed to the Office of Institutional Research and Effectiveness, in Agnes Scott "Main" Hall. You can reach the office by phone at 404.471.6176 or by email at cdunn@doinghg.com.
Student Body Diversity
Gender
| Students |
Total Full-Time |
Total Part-Time |
Grand Total |
| Men |
1.2% (13) |
8.8% (3) |
1.5% (16) |
| Women |
98.8% (1030) |
91.1% (31) |
98.5% (1061) |
| Grand Total |
100.0% (1043) |
100.0% (34) |
100.0% (1077) |
Race/Ethnicity
| Students |
Total Full-Time |
Total Part-Time |
Grand Total |
| Nonresident Alien |
2.6% (27) |
2.9% (1) |
2.6% (28) |
| Hispanic/Latino |
13.2% (138) |
5.9% (2) |
13.0% (140) |
| American Indian or Alaska Native |
0.4% (4) |
|
0.4% (4) |
| Asian |
4.8% (50) |
5.9% (2) |
4.8% (52) |
| Black or African American |
33.6% (350) |
52.9% (18) |
34.2% (368) |
| Native Hawaiian or Other Pacific Islander |
0.3% (3) |
|
0.3% (3) |
| White |
38.4% (400) |
23.5% (8) |
37.9% (408) |
| Two or More Races |
5.7% (59) |
2.9% (1) |
5.6% (60) |
| Race and Ethnicity Unknown |
1.2% (12) |
5.9% (2) |
1.3% (14) |
| Grand Total |
100.0% (1043) |
100.0% (34) |
100.0% (1077) |
Pell Recipients*
| Students |
Total Full-Time |
Total Part-Time |
Grand Total |
| *Degree-Seeking Students Only |
39.1% (350) |
50.0% (1) |
39.1% (350) |
